Examine the evolution of unit frequency along the text
Goal
Examine how the frequency of segment types evolves from the beginning to the end of a segmentation.
Prerequisites
Some text has been imported in Orange Textable (see Cookbook: Text input) and it has been segmented in smaller units (see Cookbook: Segment text in smaller units).
Ingredients
Widget
Icon
Quantity
1

Procedure
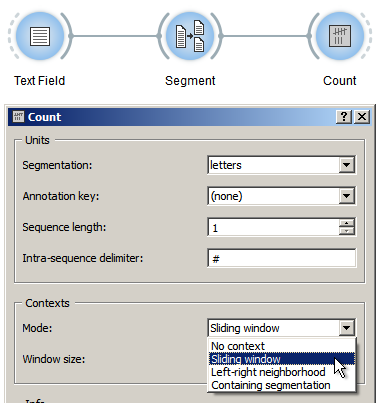
Figure 1: Examine the evolution of unit frequency with an instance of Count
Create an instance of Count.
Drag and drop from the output (righthand side) of the widget that has been used to segment the text, here Segment (letters), to the input of Count (lefthand side).
Double-click on the icon of Count to open its interface.
In the Units section, select the segmentation whose units will be counted.
In the Context section, choose Mode: Sliding window.
Set the Window size parameter to the desired value; with the minimum value of 1, frequency will be counted separately at every successive position in the segmentation, whereas a larger value n > 1 will have the effect that frequency will be counted in larger and partially overlapping spans (segments 1 to n, then 2 to n + 1, and so on), resulting in a smoother curve.
Click the Send button or tick the Send automatically checkbox.
A table showing the results is then available at the output of Count; to display or export it, see Cookbook: Table output.
Comment
It is also possible to define units as segment pairs (bigrams), triples (trigrams), and so on, by increasing the Sequence length parameter in the Units section.
If Sequence length is set to a value greater than 1, the string appearing in the Intra-sequence delimiter field will be inserted between the elements composing each n-gram in the column headers, which can enhance their readability. The default is
#but you can change it to the delimiter of your choice.