Display table
Goal
Display an Orange Textable table.
Prerequisites
Some text has been imported in Orange Textable (see Cookbook: Text input) and possibly further processed (see Cookbook: Segmentation manipulation). A table has been created by means of one of Orange Textable’s table construction widgets (see Cookbook: Text analysis).
Ingredients
Widget
Data Table
Icon
Quantity
1
1


Procedure
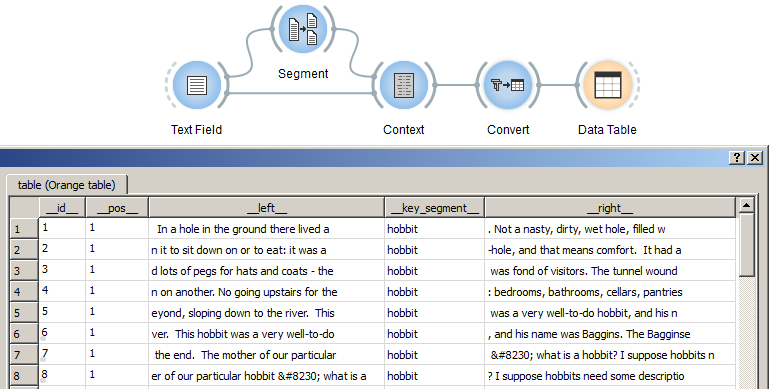
Figure 1: Display an Orange Textable table with instances of Convert and Data Table.
Create an instance of Convert and Data Table (the latter is found in the Data tab of Orange Canvas).
Drag and drop from the output (righthand side) of the widget that has been used to build a table, here Context, to the input of Convert (lefthand side).
Connect Convert to Data Table.
Double-click on the icon of Data Table to open its interface and display the table.
Comment
If the table is a document-term frequency table, you may want to change its default orientation to make it easier to read. To that effect, open the Convert instance’s interface, tick the Advanced settings checkbox, and in the Transform section, tick the transpose checkbox.
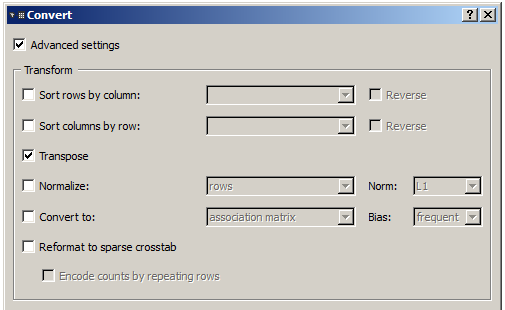
Figure 2: Change the orientation of an Orange Textable frequency table using an instance of Convert.