Variety

Measure the variety of segments.
Signals
Inputs:
SegmentationSegmentation whose segments constitute the units of variety measurement, or the contexts in which variety will be measured
Outputs:
Textable tableTable in the internal format of Orange Textable
Description
This widget inputs one or several segmentations, measures the variety of the segments of one of the segmentations (eventually within the segments defined by another segmentation), and sends the result in table format; it also allows the user to calculate the average variety by category (based on the annotation values of the segments). In order to make these two measures less dependent on the length of segmentations, it is possible to calculate their average value on a number of subsamples of fixed size.
The tables produced by the Variety widget have at least 2 columns, and at most 4. The first column contains the headers corresponding to the contexts – which are essentially defined in the same way as in the Count and Length widgets. The second column gives the variety measures and its header is __variety__, unless resampling has been applied (in which case the header will be __variety_average__). In the latter case, the third column will contain the corresponding standard deviation (header __variety_std_deviation__) and the last column the number of subsamples (header __variety_count__).
To take a simple example, consider two segmentations of the string a simple example [1]:
- label = words
| content | start | end | part of speech | word category |
|---|---|---|---|---|
| a | 1 | 1 | article | grammatical |
| simple | 3 | 8 | adjective | lexical |
| example | 10 | 16 | noun | lexical |
- label = letters (extract)
| content | start | end | letter category |
|---|---|---|---|
| a | 1 | 1 | vowel |
| s | 3 | 3 | consonant |
| i | 4 | 4 | vowel |
| … | … | … | … |
| e | 16 | 16 | vowel |
The most elementary measure made by the widget is that of the number of types or variety. For example, for the segmentation letters, by defining the units based on the content of the segments:
| __context__ | __variety__ |
|---|---|
| __global__ | 8 |
Naturally, it is possible to define types based on the values associated to an annotation key, for example letter category:
| __context__ | __variety__ |
|---|---|
| __global__ | 2 |
It is also possible to weigh the variety according to the frequency of types. To do this, we can calculate the perplexity of the segment distribution, that is to say the exponential of the entropy on this distribution. This measure is equal to the variety only if the segment types have a uniform frequency; it decreases and tends towards 0 as the segment distribution departs from uniformity and gradually becomes deterministic. As an example, here is the perplexity for letter category:
| __context__ | __variety__ |
|---|---|
| __global__ | 1.97962633005 |
The difference observed between the variety with or without weighing (1.96 vs 2) shows the deviation from uniformity in the distribution of letter categories in this example.
Rather than looking at the variety (weighed or not) of the segment types in general, we can look at their average variety within a category. For example, we can ask what is the average variety of letters depending on the letter category:
| __context__ | __variety__ |
|---|---|
| __global__ | 4.0 |
On average, in our example, a type of letter (consonant or vowel) is thus represented by 4.0 distinct letters – as long as we give the same weight to each category. The alternative consists of weighing the categories according to their frequency, which would result in our case in giving more weight to the variety of consonants (whose frequency is 9) than to that of the vowels (whose frequency is 6) in our average calculation:
| __context__ | __variety__ |
|---|---|
| __global__ | 4.14285714286 |
From the increase observed compared to the case where the categories are not weighed, we can deduce that the number of distinct consonants is higher than that of the vowels.
To sum up, weighing (or not) the frequencies of units is the basis of the distinction between variety and perplexity; moreover, in the case where we calculate the average variety/perplexity per category, it is possible to weigh (or not) by the frequency of categories.
The different variety measures presented above can then be combined with the same context (i.e. table rows) specification modes as in the Length widget: the first mode consists in defining the contexts based on the content or the annotations of a given segmentation; the second lies on the concept of a “window” of n segments that we progressively “slide” from the beginning to the end of the segmentation.
All variety measures (weighed or not, simple or by category) are sensitive to the sample size, which in our case means the segmentation length. As such, they are in principle not directly comparable among/between of different lengths. Consider for example the (unweighted) variety of letters (units) in words (contexts):
| __context__ | __variety__ |
|---|---|
| a | 1 |
| simple | 6 |
| example | 6 |
To reduce the effect of this dependence to the segmentation length, it is possible to adopt the following strategy: draw a set number of subsamples in each segmentation to compare and report the average variety by subsample. For example, by setting the size of the subsamples to 2 segments, and by drawing 100 subsamples for each word, we obtain the following results: [2]
| __context__ | __variety_average__ | __variety_std_deviation__ | __variety_count__ |
|---|---|---|---|
| a | — | — | — |
| simple | 1.59 | 0.491833305094 | 100 |
| example | 1.52 | 0.499599839872 | 100 |
Here, we can see that the variety average in simple is very slightly higher than in example because simple is a shorter word and has no repeating letters. Moreover, since the article a is only one letter, our operation cannot build subsamples of 2 letters to compute and report their average variety, hence the missing values for variety average, standard deviation and count.

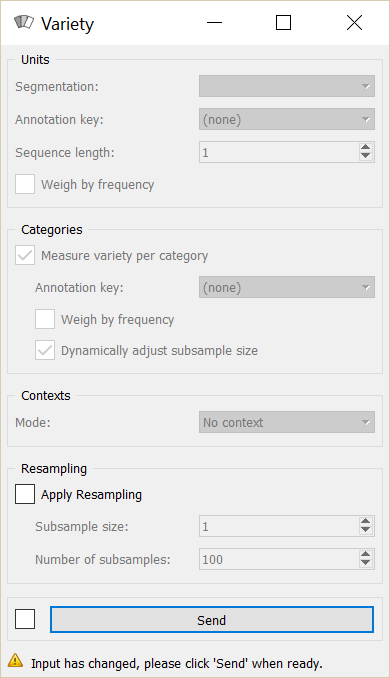
Figure 1: Variety widget.
We now move on to the presentation of the widget interface (see figure 1). It has four separate sections, for unit specification (Units), category specification (Categories), context specification (Contexts), and resampling parameters (Resampling).
In the Units section, the Segmentation drop-down menu allows the user to select among the input segmentations the one whose segments will be the basis of the variety calculation. The Annotation key menu shows the possible annotation keys associated to the chosen segmentation; if one of these keys is selected, the corresponding annotation values will be used; if on the other hand the value (none) is selected, the content of the segments will be used. The Sequence length drop-down menu allows the user to indicate if the widget should consider the isolated segments or the n–grams. Finally, the Weigh by frequency checkbox allows the user to enable the weighing of the units by their frequency (thus the perplexity measure rather than the variety). Checking the Dynamically adjust subsample size box permits a more robust variety estimation. This calculation uses the RMSP subsample size adjustment method described in Xanthos and Guex 2015.
In the Categories section, the Measure diversity per category checkbox triggers the calculation of the average diversity by category. The Annotation key drop-down menu allows the user to select the annotation key whose values will be used for the category definitions. The Weigh by frequency checkbox allows the user to enable the weighing by the category frequency.
The Contexts section is available in several variants depending on the value selected in the Mode drop-down menu. The latter allows the user to choose among the context specification modes described above. The No context mode corresponds to the case where the variety measure is applied globally to the entire unit segmentation.
The Sliding window mode (see figure 2) implements the notion of a “sliding window” introduced earlier. It allows the user to observe the evolution of variety throughout the segmentation. The only parameter is the window size (in number of segments), set by means of the Window size cursor.

Figure 2: Variety widget (Sliding window mode).

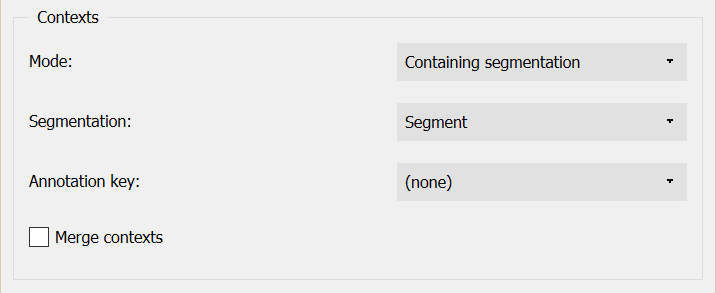
Figure 3: Variety widget (Containing segmentation mode).
Finally, the Containing segmentation mode (see figure 3) corresponds to the case where the contexts are defined by the segment types appearing in a given segmentation. This segmentation is selected among the input segmentations by means of the Segmentation drop-down menu. The Annotation key menu shows the possible annotation keys associated to the selected segmentation; if one of these keys is selected, the corresponding annotation values will constitute the row headers; if on the other hand the value (none) is selected, the content of the segments will be used. The Merge contexts checkbox allows the user to measure the variety globally in the entire segmentation that defines the contexts.
In the Resampling section, the Apply resampling checkbox allows the user to enable the calculation of the average diversity in subsamples of fixed size. The number of segments by subsample is determined by the Subsample size cursor, and the number of subsamples with Number of subsamples.
The Send button triggers the emission of a table in the internal format of Orange Textable, to the output connection(s). When it is selected, the Send automatically checkbox disables the button and the widget attempts to automatically emit a segmentation at every modification of its interface or when its input data are modified (by deletion or addition of a connection, or because modified data is received through an existing connection).
The informations given under the Send button indicate if a table has been correctly emitted, or the reasons why no table is emitted (no input data, typically).
Messages
Information
- Data correctly sent to output.
- This confirms that the widget has operated properly.
- Settings were (or Input has) changed, please click ‘Send’ when ready.
- Settings and/or input have changed but the Send automatically checkbox has not been selected, so the user is prompted to click the Send button (or equivalently check the box) in order for computation and data emission to proceed.
- No data sent to output yet: no input segmentation.
- The widget instance is not able to emit data to output because it receives none on its input channel(s).
- No data sent to output yet, see ‘Widget state’ below.
- A problem with the instance’s parameters and/or input data prevents it from operating properly, and additional diagnostic information can be found in the Widget state box at the bottom of the instance’s interface (see Warnings below).
Warnings
- Resulting table is empty.
- No table has been emitted because the widget instance couldn’t find a single element in its input segmentation(s). A likely cause for this problem (when using the Containing segmentation mode) is that the unit and context segmentations do not refer to the same strings, so that the units are in effect not contained in the contexts. This is typically a consequence of the improper use of widgets Preprocess and/or Recode (see Caveat).
Footnotes
| [1] | By convention, we do not indicate here the string index associated with each segment but only its start and end positions, along with the various annotation values associated with it; moreover, for the sake of readability, we do indicate the content of each segment, though it is not formally part of the segmentation (but rather of the string to which the segmentation refers). |
| [2] | The example has an instructive purpose; in practice we will typically use a clearly higher subsample size, for example 50 segments or more. |